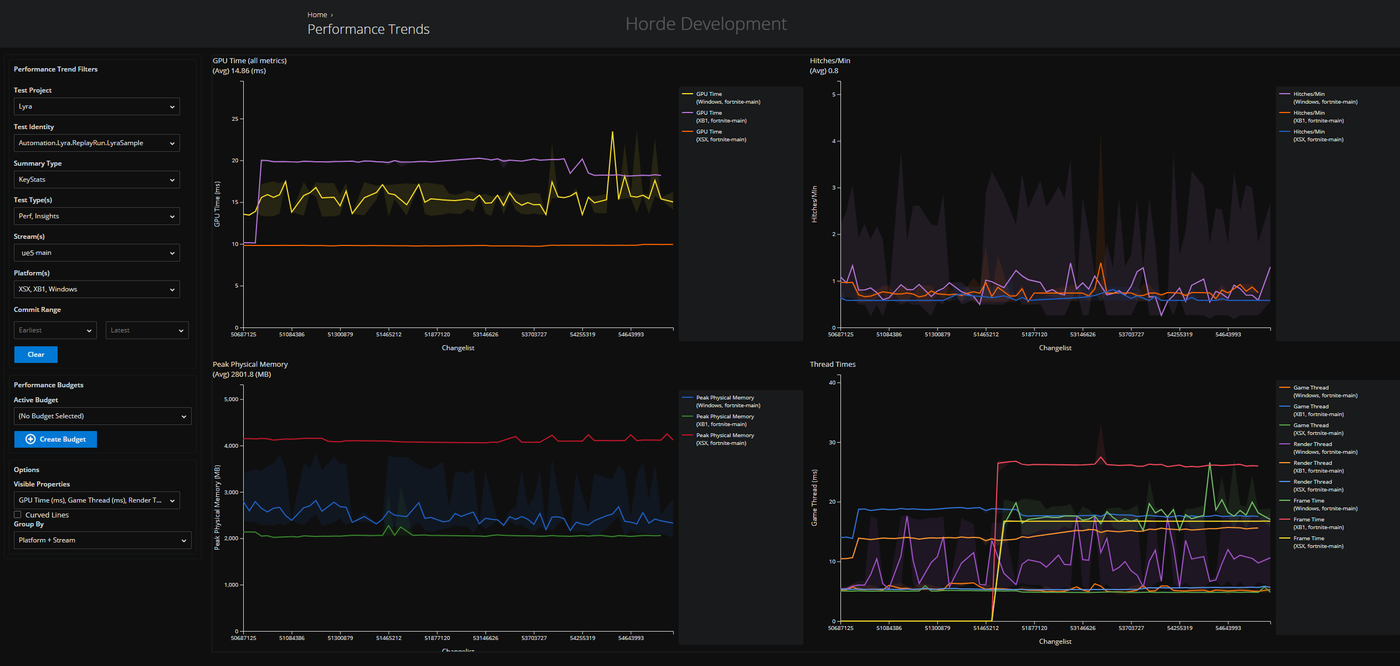
Screenshot of the Horde Performance Trends dashboard, from the Epic Developer Community forum thread.
This is a summary of my forum thread on the Epic Developer Community forums, in which I tried to get RunLocalTests results from Unreal Engine 5.8 into the Horde Performance Trends dashboard instead of only the local SummaryTable.html. The steps below follow that thread. This is not an official guide, and at the time of writing the thread was not fully resolved, but the method was working. Epic’s engineer had not yet confirmed the fix, but they are working on it.
What you need
- A source build of UE 5.8.0 (the thread’s author used this, not the Launcher build)
- Docker
- A GitHub account with access to Epic’s
ghcr.io/epicgamescontainer packages, and the GitHub CLI (gh) to log in with it - The
AutomatedPerfTestingplugin, which providesRunLocalTests.batandAutoPerfTests.xml
1. Log in to GitHub and the container registry
Horde server is published as a container image on GitHub Container Registry (ghcr.io). Docker can’t use your GitHub login directly, so you pass a GitHub token to it.
Install the GitHub CLI, then log in:
gh auth login
Pulling packages needs the read:packages scope. Add it if it’s missing:
gh auth refresh -h github.com -s read:packages
Log Docker into ghcr.io with your GitHub username and the token from gh:
gh auth token | docker login ghcr.io -u YOUR_GITHUB_USERNAME --password-stdin
If the pull in the next step fails with “denied”, your GitHub account probably doesn’t have access to Epic’s packages yet. Check your access in the Epic Games GitHub organisation.
2. Pull the Docker images
Pull the Horde server image, then the supporting services it uses (MongoDB, Redis, and ClickHouse for analytics):
docker pull ghcr.io/epicgames/horde-server:5.8.0
docker pull mongo:7
docker pull redis:7
docker pull clickhouse/clickhouse-server
The mongo, redis and clickhouse tags are examples. Check Epic’s Horde documentation for the versions it expects before you use them in anything important.
3. Create a network and start the supporting services
The containers talk to each other by name, so put them on one Docker network:
docker network create horde-net
Start MongoDB and Redis:
docker run -d --name horde-mongo --network horde-net mongo:7
docker run -d --name horde-redis --network horde-net redis:7
Start ClickHouse with the user and password that the config files use. Replace the placeholders with your own values:
docker run -d --name horde-clickhouse --network horde-net \
  -e CLICKHOUSE_USER=username \
  -e CLICKHOUSE_PASSWORD=password \
  -p 8123:8123 \
  clickhouse/clickhouse-server
Create the ingest database that the table in step 5 goes into:
docker exec -it horde-clickhouse clickhouse-client --user username --password password --query "CREATE DATABASE IF NOT EXISTS ingest"
4. Configure the Horde server
Put two files in the folder you’ll start the server from.
server.json enables the structured analytics and performance trends plugins, backed by ClickHouse:
{
  "Horde": {
    "AuthMethod": "Anonymous",
    "ConfigPath": "globals.json",
    "Telemetry": [{ "Type": "Mongo", "RetainDays": 1 }],
    "Plugins": {
      "StructuredAnalytics": { "Enabled": true, "BackendName": "ClickHouse", "DisableStreamBasedAuth": true },
      "PerformanceTrends": { "Enabled": true, "DisableStreamBasedAuth": true },
      "ClickHouseTelemetry": {
        "Enabled": true,
        "ConnectionString": "Host=horde-clickhouse;Port=8123;Database=ingest;Username=username;Password=password",
        "AutoCreateTables": true
      }
    }
  }
}
globals.json sets the same ClickHouse connection under plugins and points the analytics store at the default telemetry definitions:
{
  "version": 2,
  "include": [{ "path": "$(HordeDir)/Defaults/default.global.json" }],
  "plugins": {
    "clickhousetelemetry": { "ConnectionString": "Host=horde-clickhouse;Port=8123;Database=ingest;Username=username;Password=password", "AutoCreateTables": true },
    "structuredanalytics": { "BackendName": "ClickHouse", "DisableStreamBasedAuth": true },
    "performancetrends": { "BackendName": "ClickHouse", "DisableStreamBasedAuth": true }
  }
}
Use placeholder credentials and keep them out of version control. The thread’s configs used Database=my_database while the table was created in ingest. Make sure the database name in both files matches the database where you create the table.
5. Create the ClickHouse table
The thread’s author found that AutoCreateTables did not produce a table that the dashboard could read, so they created it by hand. The table needs about 49 columns. This shortened version shows the key ones; the full CREATE TABLE statement is in the thread:
docker exec -it horde-clickhouse clickhouse-client --user username --password password --query "
CREATE TABLE ingest.horde_state_performance_key_stats
(
    _telemetry_store_id String,
    _app_id Nullable(String),
    _app_version Nullable(String),
    _app_environment Nullable(String),
    _session_id Nullable(String),
    frametime_avg Float64,
    -- ...remaining columns from the thread...
    stream_id Nullable(String),
    schema_version Int64,
    telemetry_timestamp Nullable(DateTime)
)
ENGINE = MergeTree()
ORDER BY tuple()
"
If you need to start over, drop the table first:
docker exec -it horde-clickhouse clickhouse-client --user username --password password --query "DROP TABLE IF EXISTS ingest.horde_state_performance_key_stats"
6. Start the Horde server
Remove any old container, then start a fresh one with the config files mounted:
docker rm -f horde-server

docker run -d --name horde-server --network horde-net -p 5000:5000 -p 5002:5002 \
  -e Horde__MongoConnectionString="mongodb://horde-mongo:27017" \
  -e Horde__RedisConnectionConfig="horde-redis:6379" \
  -v $(pwd)/globals.json:/app/Data/globals.json \
  -v $(pwd)/server.json:/app/Data/server.json \
  ghcr.io/epicgames/horde-server:5.8.0
Follow the logs while it starts:
docker logs -f horde-server
Confirm the table exists and is empty:
docker exec -it horde-clickhouse clickhouse-client --user username --password password --query "SELECT * FROM ingest.horde_state_performance_key_stats LIMIT 50"
7. Run the local tests
From the project’s Build/BatchFiles folder, run RunLocalTests.bat. It calls RunUAT BuildGraph with AutoPerfTests.xml, using -set:DoPerf=true and -set:GenerateLocalReports=true. The run writes CSV files under Saved/Performance/SequenceTest/Perf/Win64/CSV.
8. Send the results to Horde
Run PerfReportTool on that CSV folder and ask it for the telemetry output:
dotnet "C:\Unreal5.8\Engine\Binaries\DotNET\CsvTools\PerfReportTool.dll" `
  -csvdir "C:\Unreal5.8\YourGame\Saved\Performance\SequenceTest\Perf\Win64\CSV" `
  -reportType ClientPerf `
  -reportxmlbasedir "C:\Unreal5.8\Engine\Plugins\Performance\AutomatedPerfTesting\Build\Scripts\PerfReport" `
  -summaryTable KeyStats -noDetailedReports -csvTable `
  -summaryTableDataToTelemetry -telemetryTestIdentity "YourTest" `
  -summaryTableOutputFormats csv
The thread’s author found that the -summaryTableOutputFormats csv flag was needed for SummaryTable.csv to be created. Without it, nothing was written to the CsvTools folder.
Known problems in the thread
- Missing stream context.
PerfReportToolonly knows the branch, not the stream, when it runs outside a Horde build. The dashboard expectsstream_id, so the data does not render. The workaround was to patch the tool. - Missing values. Rows arrived without
_app_id,_app_version,_app_environmentor_telemetry_store_id, and the dashboard showed a single data point. - Patched tool. Epic’s engineer said the stream context can be passed from outside the CI build with
-telemetryPayloadMetadata "StreamId=test-stream;Changelist=100;", but this requires a modifiedPerfReportTool. It is not part of the stock tool. - Unconfirmed fix. The thread’s last saved replies say the summary data is averaged into one point per report, which may not match what the dashboard is expected to show. The engineer said they would review the setup later.
If you need this to work today, treat the steps above as a starting point and expect to debug the ClickHouse rows against the Horde data model.